Wave 3 snapshot
The following information is based on Wave 3 unweighted data, where information refers to all children in the study who participated in Wave 3 unless specified otherwise. These percentages may differ slightly from the estimated proportions in the Australian population.
Working lives
As might be expected, more mothers were working as children got older. Three-quarters of K cohort mothers (with children aged 8 to 9 years in Wave 3) were working in paid employment compared with 63 per cent of B cohort mothers (with children aged 4 to 5 years). Working part-time was common among mothers with children from both age groups, with close to half of mothers engaged in part-time work. Approximately 2 per cent of mothers were looking for work.
In families where the study child lived with both parents, most fathers (93 per cent) were engaged in full-time employment and a further 3 per cent were in part-time work. Where parents no longer lived together, around 78 per cent of fathers were working full-time. Of those parents in paid work, 84 per cent of mothers and fathers said they were able to work flexible hours, and 84 per cent of mothers and 78 per cent of fathers agreed or strongly agreed that having both work and family responsibilities gave their life more variety. However, 62 per cent of fathers and 41 per cent of mothers also said that because of work responsibilities they have missed out on home or family activities in which they would have liked to have taken part.
Parenting and support
Many of the parents in the study felt positive about their parenting skills, with 36 percent of mothers and 43 per cent of fathers describing themselves as a better than average parent, and a further 26 per cent of mothers and 25 per cent of fathers describing themselves as a very good parent. In addition, 92 per cent of mothers and 80 per cent of fathers said they often or always had warm, close times together with their child. Parents seemed well supported by their community, with 75 per cent of mothers and 63 per cent of fathers saying they had someone to confide in either most or all of the time, and 77 per cent of mothers and 55 per cent of fathers in the study saying they had contact with their friends weekly or daily.
Grandparents
Grandparents continue to play an important role in the lives of the children in the study. As Figure 1 shows, of children living with both parents, two-thirds (66 per cent) saw their maternal grandparents at least once a month, and 57 per cent saw their paternal grandparents at least once a month. Three-quarters (74 per cent) of mothers say their own parents supported them sometimes or more often in raising their children.
Figure 1: Frequency of grandparent contact

Source: LSAC K and B cohort, Wave 3.
Schooling
Carers or teachers reported that 88 per cent of B cohort children very often or always enjoyed school, preschool or child care. K cohort children also enjoyed school, with 84 per cent of their teachers saying that the children were often or very often eager to learn new things. Three-quarters (74 per cent) of these teachers reported that the children often or very often paid good attention in class.
A substantial minority of K cohort children reported that other kids at school treated them badly. Figure 2 shows that approximately 36 per cent of K cohort children said that other kids sometimes, often, or always picked on them. A similar proportion said that other kids said mean things to them. Over 50 per cent of children stated that kids never said bad things about them. Approximately 18 per cent of K cohort children stated that other kids sometimes, often, or always hit them.
Figure 2: Eight to nine year-old ratings of frequency of poor treatment by other kids at school

Source: LSAC K cohort, Wave 3.
Many parents have contact with their child's school (see Figure 3), with around three-quarters having attended a school event, contacted their child's teacher or visited their child's classroom in the past year. Approximately one-third of parents had volunteered in their child's class or helped with an excursion in the past year.
Figure 3: Parent contact with child's school

Source: LSAC K and B cohorts, Wave 3.
Reading to children
Reading to children was a common activity among parents of 4 to 5 year olds. Over half (54 per cent) of children were read to by their parents almost every day and another quarter (26 per cent) were read to 3 to 5 days a week. Fewer parents read to their 8 to 9 year old children, with 12 per cent of children being read to nearly every day and 18 00000000per cent read to 3 to 5 days a week.
Family activities
Children are often involved in everyday activities, such as cooking and caring for pets. Around 40 per cent of parents reported that their children helped with these activities nearly every day and 30 per cent had children who helped on 3 to 5 days per week. About four-fifths of mothers had their evening meal with their 4 to 5 and 8 to 9 year-old children every day (see Figure 4). This was less common among fathers (58 per cent of fathers of 4 to 5 year olds and 65 per cent of fathers of 8 to 9 year olds had their evening meal with their children).
Figure 4: How often parents have an evening meal with child

Source: LSAC K and B cohort, Wave 3.
Eight to nine year olds overwhelmingly reported enjoying family time: about three-quarters (76 per cent) of 8 to 9 year olds reported that they had fun with their family lots of times and a further one-fifth (21 per cent) reported having fun with their family sometimes.
For children aged 8 to 9 years, 28 per cent of mothers and 7 per cent of fathers helped their child with homework every day, and a further 37 per cent of mothers and 40 per cent of fathers helped with homework a few times a week. Many mothers talked with their children about how school was going: 69 per cent of mothers with 4 to 5 year olds and 88 per cent of mothers with 8 to 9 year olds talked about this with their child every day (see Figure 5). While fewer fathers did this every day (58 per cent of fathers of 4 to 5 year olds and 65 per cent of fathers of 8 to 9 year olds), the great majority talked about school with their children at least a few times a week.
Figure 5: How often parents talk to children about school, pre-school or child care

Source: LSAC B and K cohort, Wave 3 data.
Nearly three-quarters (74 per cent) of K cohort children, aged 8 to 9 years, reported that they never or rarely spend time at home by themselves. However, 20 per cent and 6 per cent of 8 to 9 year olds respectively reported that they spent time at home by themselves sometimes each week and almost every day.
Approximately 17 per cent of K cohort children reported that their family yelled at each other often (13 per cent) or always (4 per cent). The remaining 83 per cent of K cohort children reported that their family yelled at each other only sometimes (40 per cent), hardly ever (34 per cent) or never (9 per cent).
Sleeping
Most B cohort parents reported that their child's sleeping habits/patterns were not a problem (70 per cent), as did 80 per cent of K cohort parents. Children's bedtimes became slightly less regular as they got older. Half (49 per cent) of the B cohort parents said that their children always went to bed at a regular time compared to 45 per cent of K cohort parents.
Child wellbeing self report
The overwhelming majority of K cohort children reported they were happy at least some of the time. Sixty-six per cent of 8 to 9 year olds said that they felt happy lots of the time and a further 32 per cent said they felt happy sometimes. Ninety five per cent of children reported that they hardly ever (46 per cent) or sometimes (49 per cent) felt scared or worried. A further 5 per cent reported feeling scared or worried lots of times. Similar proportions of 8 to 9 year olds reported feeling sad: hardly ever (43 per cent); sometimes (52 per cent); and lots of times (5 per cent).
Children's health
Nine in 10 parents (89 per cent) reported that their child was in excellent or very good health.
By the time children were aged 8 to 9 years 30 per cent had at some time been diagnosed with asthma by a doctor, compared with 20 per cent of 4 to 5 year olds. However, only half (52 per cent) of diagnosed 8 to 9 year olds had taken medication for asthma in the previous 12 months, compared with two-thirds (67 per cent) of diagnosed 4 to 5 year olds.
Skin and food allergies are two of the most common ongoing conditions experienced by the study children. Eczema affected 14 per cent of children aged 4 to 5 years and 11 per cent of children aged 8 to 9 years. Seven per cent of 4 to 5 year olds and 6 per cent of 8 to 9 year olds were allergic to certain foods.
Body Mass Index and body image
Study children have their height and weight measured during the main wave interview and from these measurements the Body Mass Index (BMI) can be calculated by dividing a child's weight in kilograms by their height in meters squared. After adjusting for their age, this index score can be used to classify children as underweight, normal weight, overweight or obese. The proportions of children within each weight status category from the infant and child cohorts is shown in Table 5. The majority of parents (87 per cent) believed that their children were of normal weight.
| Weight status, based on BMI | 4 to 5 year olds (%) | 8 to 9 year olds (%) |
|---|---|---|
| Underweight | 6.2 | 5.4 |
| Normal weight | 71.0 | 71.0 |
| Overweight | 17.3 | 17.4 |
| Obese | 5.5 | 6.2 |
Note: The calculation of weight status is based on BMI cut-offs from Cole et al. (2000, 2007).
Source: LSAC K cohort and B cohort, Wave 3.
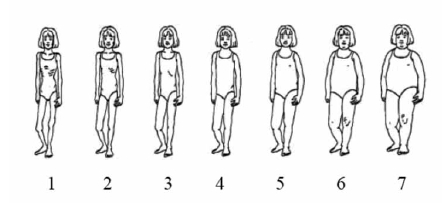
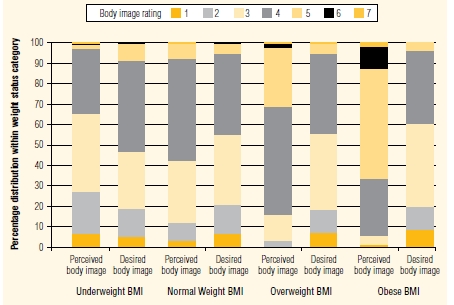
K cohort children rated their perceived body image and desired body image on the scale shown in Figure 6 (for boys) and Figure 7 (for girls). The distribution of perceived and desired body image scores for children by weight status (based on their BMI) is shown in Figure 8. These findings show that overweight and obese children correctly typically perceive themselves to be heavier than children of normal weight and also desired to lose weight. Conversely, underweight children perceived themselves to be lighter than normal weight children and desired to gain weight. Interestingly, children of normal weight desired to be lighter than they perceived themselves to be. The pattern of results for boys and girls was very similar and therefore is not shown separately.
Figure 6 Body image scale, boys

Figure 7 Body image scale, boys

Figure 8: Distribution of perceived and desired body image ratings by weight status category (based on BMI), 8 to 9 year olds

Source: LSAC K cohort, Wave 3.