How well are Australian infants and children aged 4 to 5 years doing?
This section is an edited extract from the Social Policy Research Paper no. 36, How well are Australian infants and children aged 4 to 5 years doing?, by Melissa Wake, Ann Sanson, Donna Berthelsen, Pollyanna Hardy, Sebastian Misson, Katherine Smith, Judy Ungerer, and the LSAC Research Consortium. The research uses data drawn from the B and K cohorts of the first wave of Growing Up in Australia.
This section reports on outcomes for infants and children from Wave 1 using an Outcome Index. This index provides an overall measure of how well Australian children and infants are functioning and is a composite of three domains of child functioning: health and physical development; social and emotional functioning; and learning and academic competency. Summary scores for each of these domains are calculated by combining a range of standardised measures. The domain scores are then combined into an overall Outcome Index.
The Outcome Index is a useful overall indicator of child outcomes, but has a range of limitations that need to be noted when interpreting results. First, the index can more sensitively measure outcomes at the 'problem' end of the scale compared to the positive end of the scale. This is less of a concern here as this section focuses on problem outcomes. Second, the index is a relative measure, where high and low levels refer to children's scores when compared to other children in the LSAC sample. The cut off points for determining high or low outcome scores are therefore arbitrary. Finally, there are fewer areas where it is possible or meaningful to collect outcome information on the infant cohort compared to the child cohort.
The findings also do not take into account the interrelationships among background characteristics that may contribute to or explain apparent associations. For example, although a higher proportion of children from families without a computer have low outcome scores, this result may be because families who do not own a computer are more likely to experience a range of disadvantages associated with a low socio-economic background. More generally, due to the cross-sectional nature of LSAC Wave 1 data, it is not possible to make causal links between Outcome Index scores and other variables.
Family characteristics
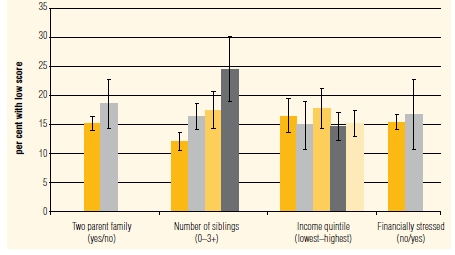
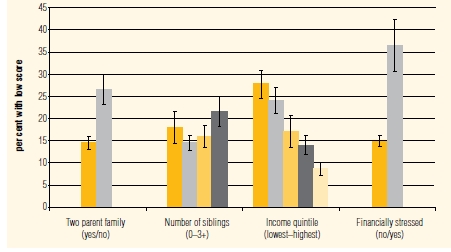
Figure 11 and Figure 12 show the respective proportions within the B and K cohort falling into the bottom 15 per cent of the overall Outcome Index distribution according to child and family characteristics.
Figure 11: Proportion of children (B cohort) with low outcome scores by family characteristics

Note: I--I indicate 95 per cent confidence intervals.
Source: LSAC B cohort Wave 1.
Figure 12: Proportion of children (K cohort) with low outcome scores by family characteristics

Note: I--I indicate 95 per cent confidence intervals.
Source: LSAC K cohort, Wave 1.
Research has consistently pointed to differences in outcomes across family types, although the causal relationships between them are unlikely to be direct. For young children, a salient distinction is whether there are one or two parents available in the home. For the purpose of LSAC, the primary parent was defined as the person who knows most about the child, and the secondary parent as anyone else with a parental relationship to the study child or a partner of the primary parent. By this definition, 11 per cent of infants from the B cohort and 15 per cent of K cohort children were in single-parent families. Figure 12 shows that in the K cohort 27 per cent of children from one parent households scored below the negative cut-off, compared to less than 15 per cent of K cohort children from two-parent families. In contrast, living in a family with one or two parents was not related to low Outcome Index scores for infants in the B cohort.
Siblings
While siblings can provide emotional support and socialisation for children, they can also lead to rivalry and make competing claims on parents' resources. The number of siblings was calculated by counting the number of people living with the study child who had a sibling relationship (including full, step, half, foster and adopted siblings) with the child. Nearly 40 per cent of the B cohort infants were an only child, compared to just 12 per cent of K cohort children. Two-fifths of both cohorts (41 per cent) were the oldest or an only child. As shown in Figures 11 and 12, a greater percentage of those with three or more siblings fell below the negative cut off than those with no or one sibling. Similarly, fewer infants who were the oldest child in the family (which in most cases indicates they were an only child) were below the negative cut-off (12 per cent) than those with older siblings. Being the oldest child was not related to negative outcomes in the K cohort.
Combined parental income and financial stress
Both low income and financial stress have negative and accumulating effects on children's development. Parents were asked what their combined present yearly income was, choosing among 16 categories which were subsequently aggregated for this report into approximate quintiles. In the B cohort, there was no relationship between household income and low outcome scores. However, for the K cohort, a higher proportion of children with low outcome scores came from families in the lowest income quintile (28 per cent) than from families in the highest income quintile (9 per cent).
Families were defined as being financially stressed if they reported experiencing four or more of seven different adverse financial situations in the last 12 months (for example, not being able to pay bills, skipping meals to save money), with 6 per cent of both the B and K cohort families being in this situation. Although financial hardship data paralleled the data on income quite closely, the disparities in K cohort outcomes were even more marked for financial stress--over one-third (36 per cent) of K cohort children from financially stressed households were below the negative cut off. Differences were not evident for the B cohort.
Differences between child and infant cohorts
Overall, in the B cohort, family characteristics had few associations with infant outcomes, whereas the associations were more pronounced in the K cohort. This may in part reflect how contextual factors impact on children's development in a cumulative process over time. This is also likely due to the fact that outcomes are more difficult to reliably measure in younger children and thus the comprehensiveness and robustness of the Outcome Index differs to some extent across the two cohorts in Wave 1. This needs to be taken into consideration when interpreting the B cohort data, including making comparisons with the K cohort.
Early literacy and family learning environments in child cohort
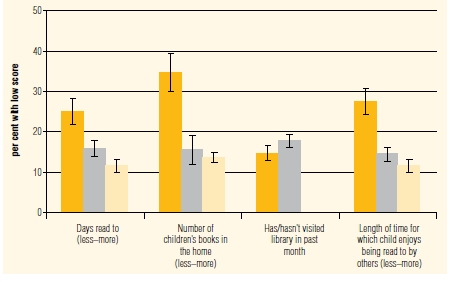
Figure 13: Proportion of the K cohort with low outcome scores by early literacy experiences

Note: I--I indicate 95 per cent confidence intervals.
Source: LSAC K cohort, Wave 1.
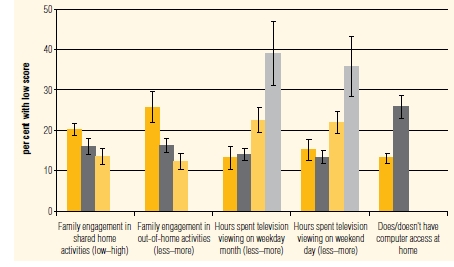
Figure 14: Proportion of the K cohort with low outcome scores by family learning characteristics

Note: I--I indicate 95 per cent confidence intervals.
Source: LSAC K cohort, Wave 1.
Figure 13 displays Outcome Index scores in relation to activities that promote early literacy. Children with less supportive early literacy environments were more likely to have low Outcome Index scores. These findings could have implications for promoting children's emergent literacy at home through drawing attention, in particular, to reading to children regularly and providing reading resources for children to access--although this would need further investigation after controlling for socioeconomic status.
Children were engaged with family members in a range of shared home activities. Figure 14 suggests that children with low engagement in shared home activities more often had lower Outcome Index scores than children with medium and high engagement. Similarly, children with lower engagement in out-of-home activities were more likely to have scores below the low Outcome Index cut-off point, suggesting that child outcomes are enhanced by shared participation of children with family members in a range of activities outside the home.
In line with previous research, the data from these analyses also suggests strong associations between high levels of television viewing and a negative Outcome Index score. A relationship between low child Outcome Index scores and access to a computer may relate to family resources.